Troubleshooting
Sometimes things don't go as planned, so if you come across an error or issue, try the following troubleshooting tips or ➡ contact us and we'll be happy to jump right in to help you out.
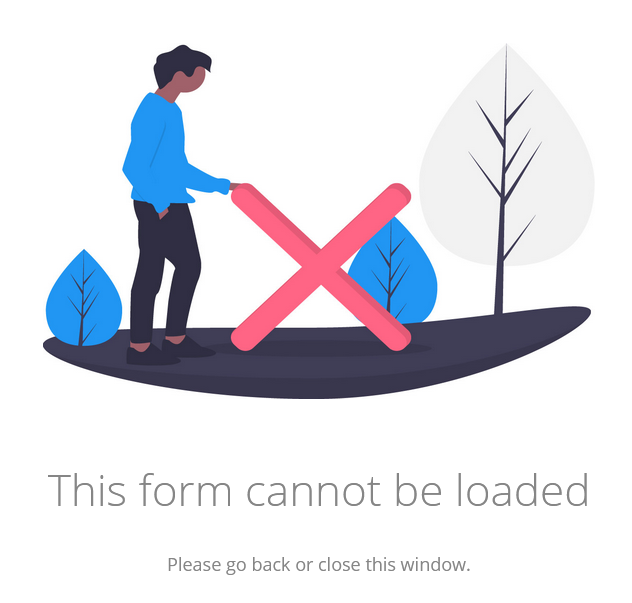
Error page when form is loaded
If you are seeing a screen with the message below, there are a couple of things you can try and check.
- Check whether you have published your project - forms and upload portals will not be accessible until they have been published.
- If you are trying to access a form session, check the form settings ➡ to see whether the ability to view/edit submitted sessions is turned off.
- Check whether the workflow is restricted ➡ and whether you have been granted access to run and start it.
- If you are trying to access a form link from a sequential form, this message will appear when that form link has already been submitted. Form links generated by the sequential form can only be submitted once.
Blank screen when form is loaded
If you are seeing a blank screen when opening a form or task link, please try the following:
- Refresh your browser and reload the page
- Turn off any VPN service you may be using, including Apple Private Relay if you are using Safari
- Close and restart your browser
- Try opening the form in incognito or private mode
- Clear your browser cache - you can find more details on how to do this here
- Try opening the form in another browser (and repeat the above steps in this other browser)
If none of the steps above work, please contact us at help@workflow86.com. If you have tried some or all of the steps above, let us know which steps you have tried in the email so we can quickly identify the issue.
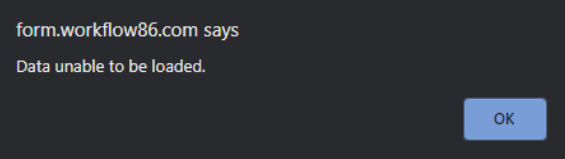
Data unable to be loaded
If you are getting a "Data is unable to be loaded" error when opening a form, it is likely that you have not yet published the workflow for that form. Workflows can't be started and forms cannot be accessed until the workflow has been published for the first time.
My placeholders are not showing up
If placeholders inside your workflow are empty or not being substituted with the correct values, check whether they may be broken. A placeholder is broken when the source of that placeholder no longer exists or cannot be found. This may be cause by the source of the placeholder having been deleted, or the placeholder having been renamed.
A placeholder that is not broken will be colored according to the data type:

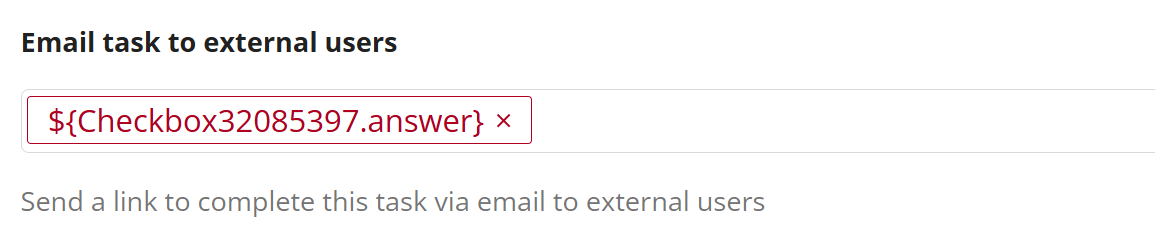
A placeholder that is broken (the source of the placeholder cannot be found or no longer exists in the workflow) will have a red outline and text:
Check the logs
The logs are the source of truth for all workflow data. If an error is encountered when a workflow is run, you will see and error state in the logs
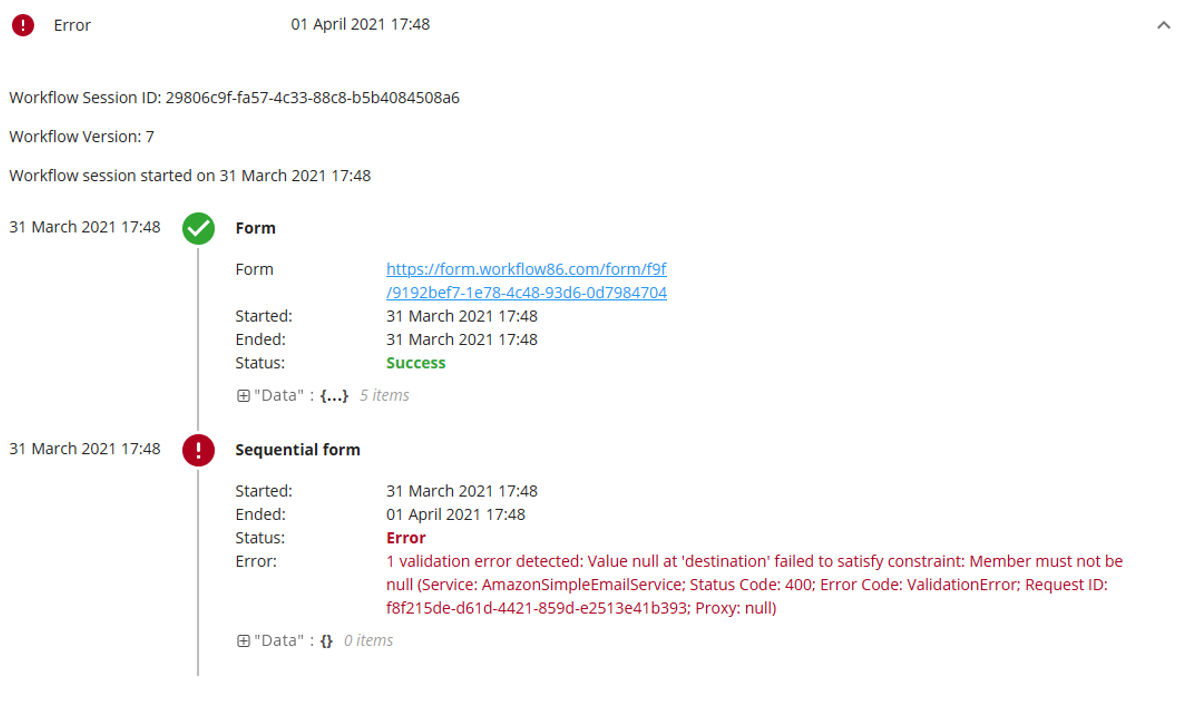
You will also find a description of the error that was encountered as well.
This will point you in the right direction for what might have gone wrong. If you need help figuring out what the error message means, just contact us and we'll be happy to help.
Check the access controls
A workflow might not be working for a user because they are not authorized to run it. Read more about access controls for workflows ➡ here
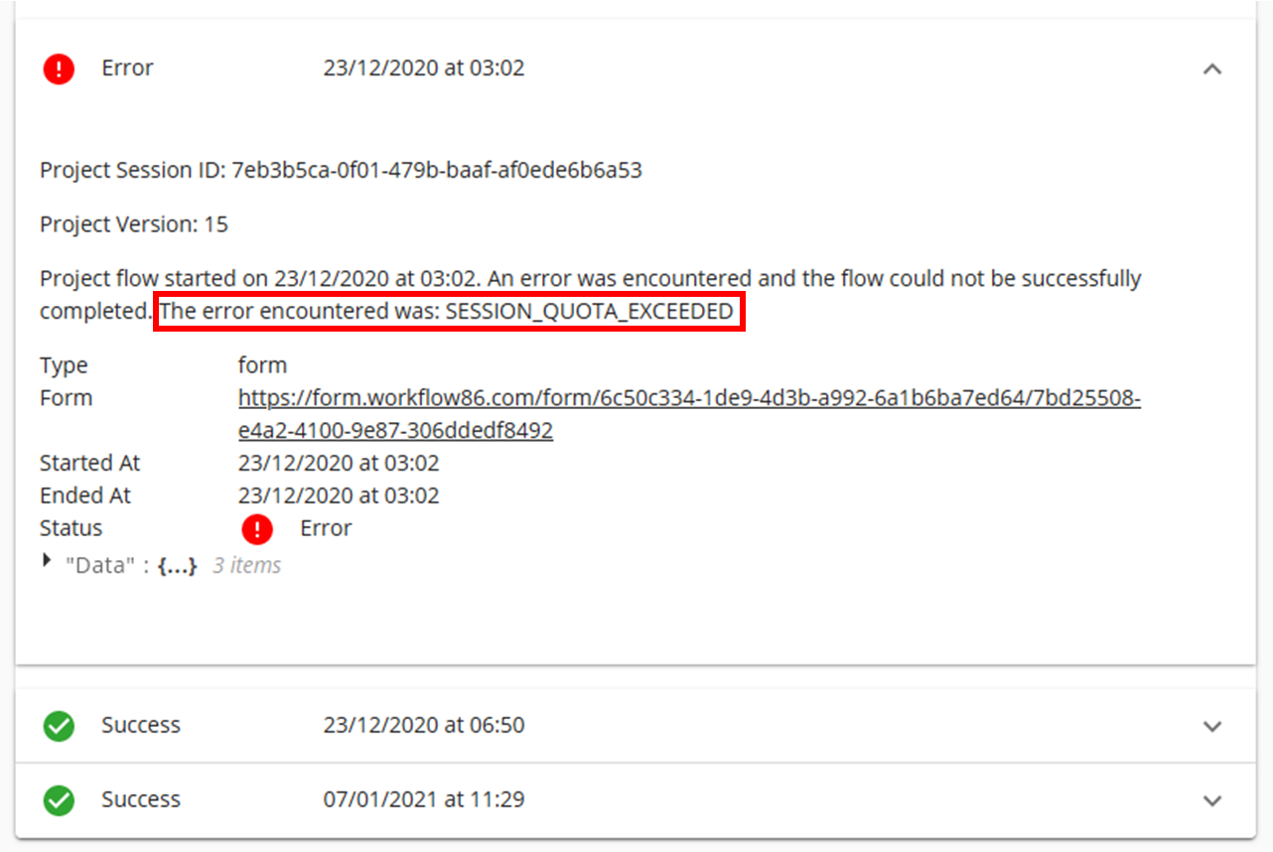
Check your subscription
If you are not receiving the results of a workflow, it could be because you have reached your session quota under your current plan. This means you cannot run anymore workflows until the quota resets at the start of the next billing period or your upgrade your plan. Read more about subscription and billing here ➡ here
Share a problematic workflow with us
If you are having issues with a workflow, you can share a template of that workflow with us so we can take a closer look at it. To share a workflow follow these steps.
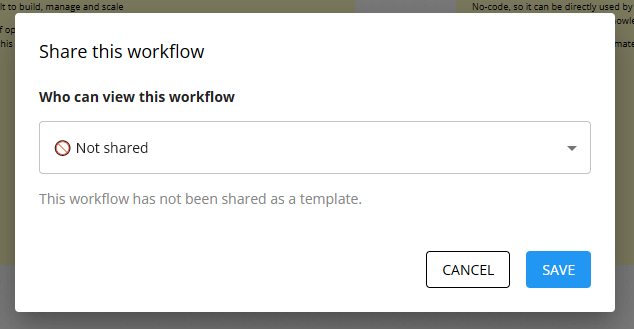
To deploy a workflow as a shareable template, click the Share button on the canvas

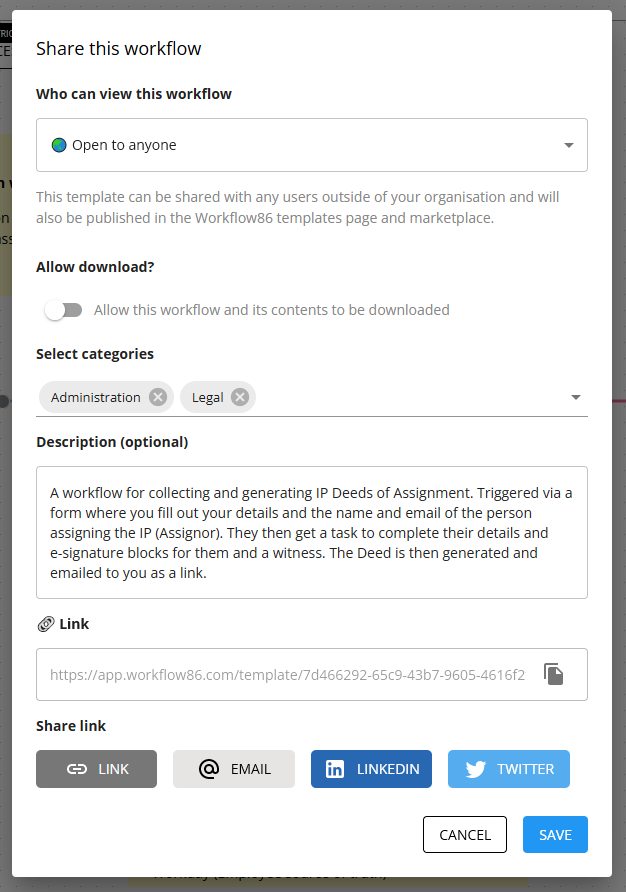
This will then open a dialog where you can select how you want to share this workflow as a template. Dy default, all workflows are not shared.
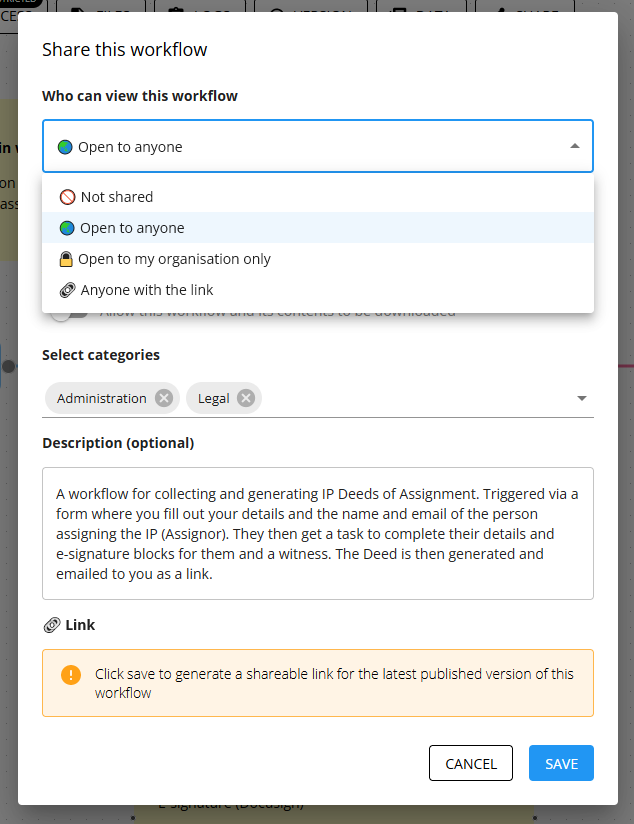
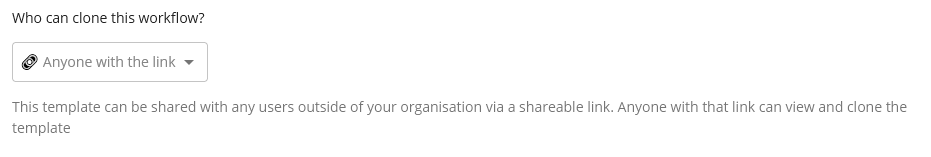
Select "Select 🔗 Share via link" This will generate a link which you can share with anyone you want to download the workflow.
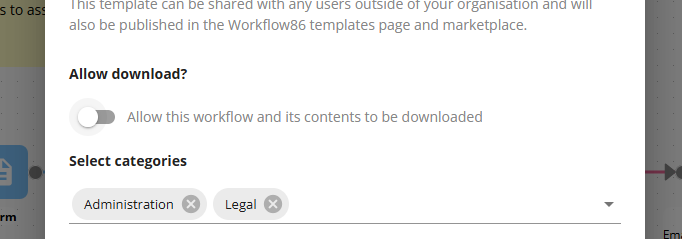
Turn on the allow download switch:
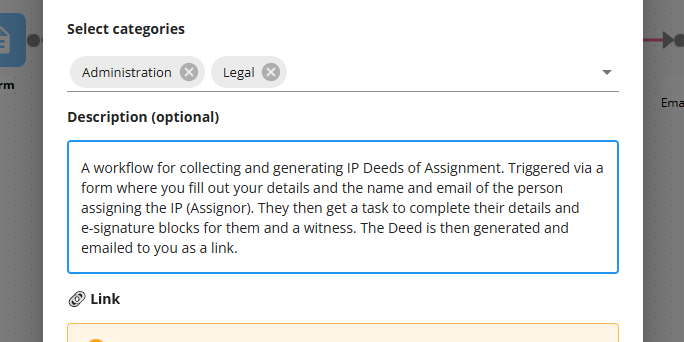
Once you have selected an sharing option, there is another dialog where you can enter a description for the workflow.
To deploy the workflow as a template, click the Save button. A link to the workflow template will then be generated:
Send us the template link
Share the template link with us via the chat or send it to support@workflow86.com
How to open the developer console
The developer console is a tool which logs the information associated with a web page, such as JavaScript, network requests, and security errors.
The information displayed in the developer console can be extremely helpful for the Workflow86 support team when we're trying to figure out how to solve an issue. In the course of troubleshooting your issue, the Workflow86 support team may ask you to take a screenshot of the developer console.
When you open the developer console, there will be several tabs or options you can select that display different types of information. Most of the time, we will request a screenshot of the Console, Network ir Inspector tabs:


Chrome
To open the developer console window on Chrome, use the keyboard shortcut CtrlShiftJ (on Windows) or CtrlOptionJ (on Mac).
Edge
To open the console on Edge, hit F12 to access the F12 Developer Tools. Once in the F12 Developer Tools, navigate to the Console tab.
Firefox
To open the console on Firefox, use the keyboard shortcut Ctrl Shift K (on Windows) or Ctrl Option K (on Mac). The toolbox will appear at the bottom of the browser window, with the Web Console activated.
Safari
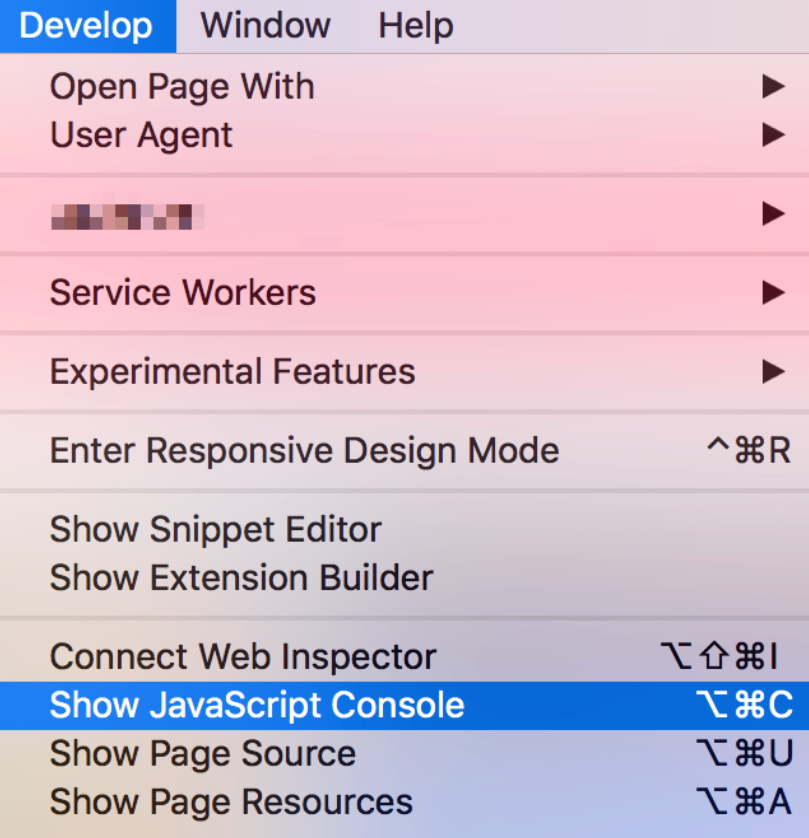
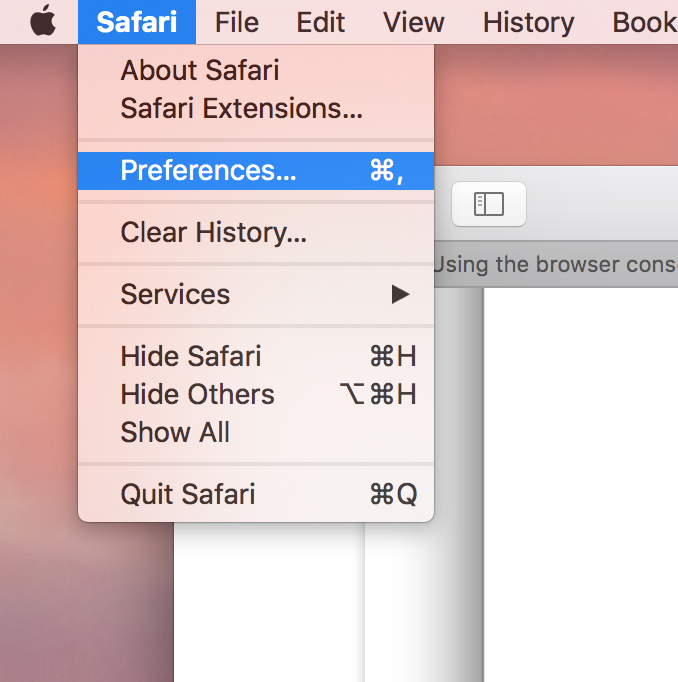
To open the console on Safari, you will first need to turn on the Develop menu. To do this, open the Safari menu in the Mac menu bar, then select Preferences.
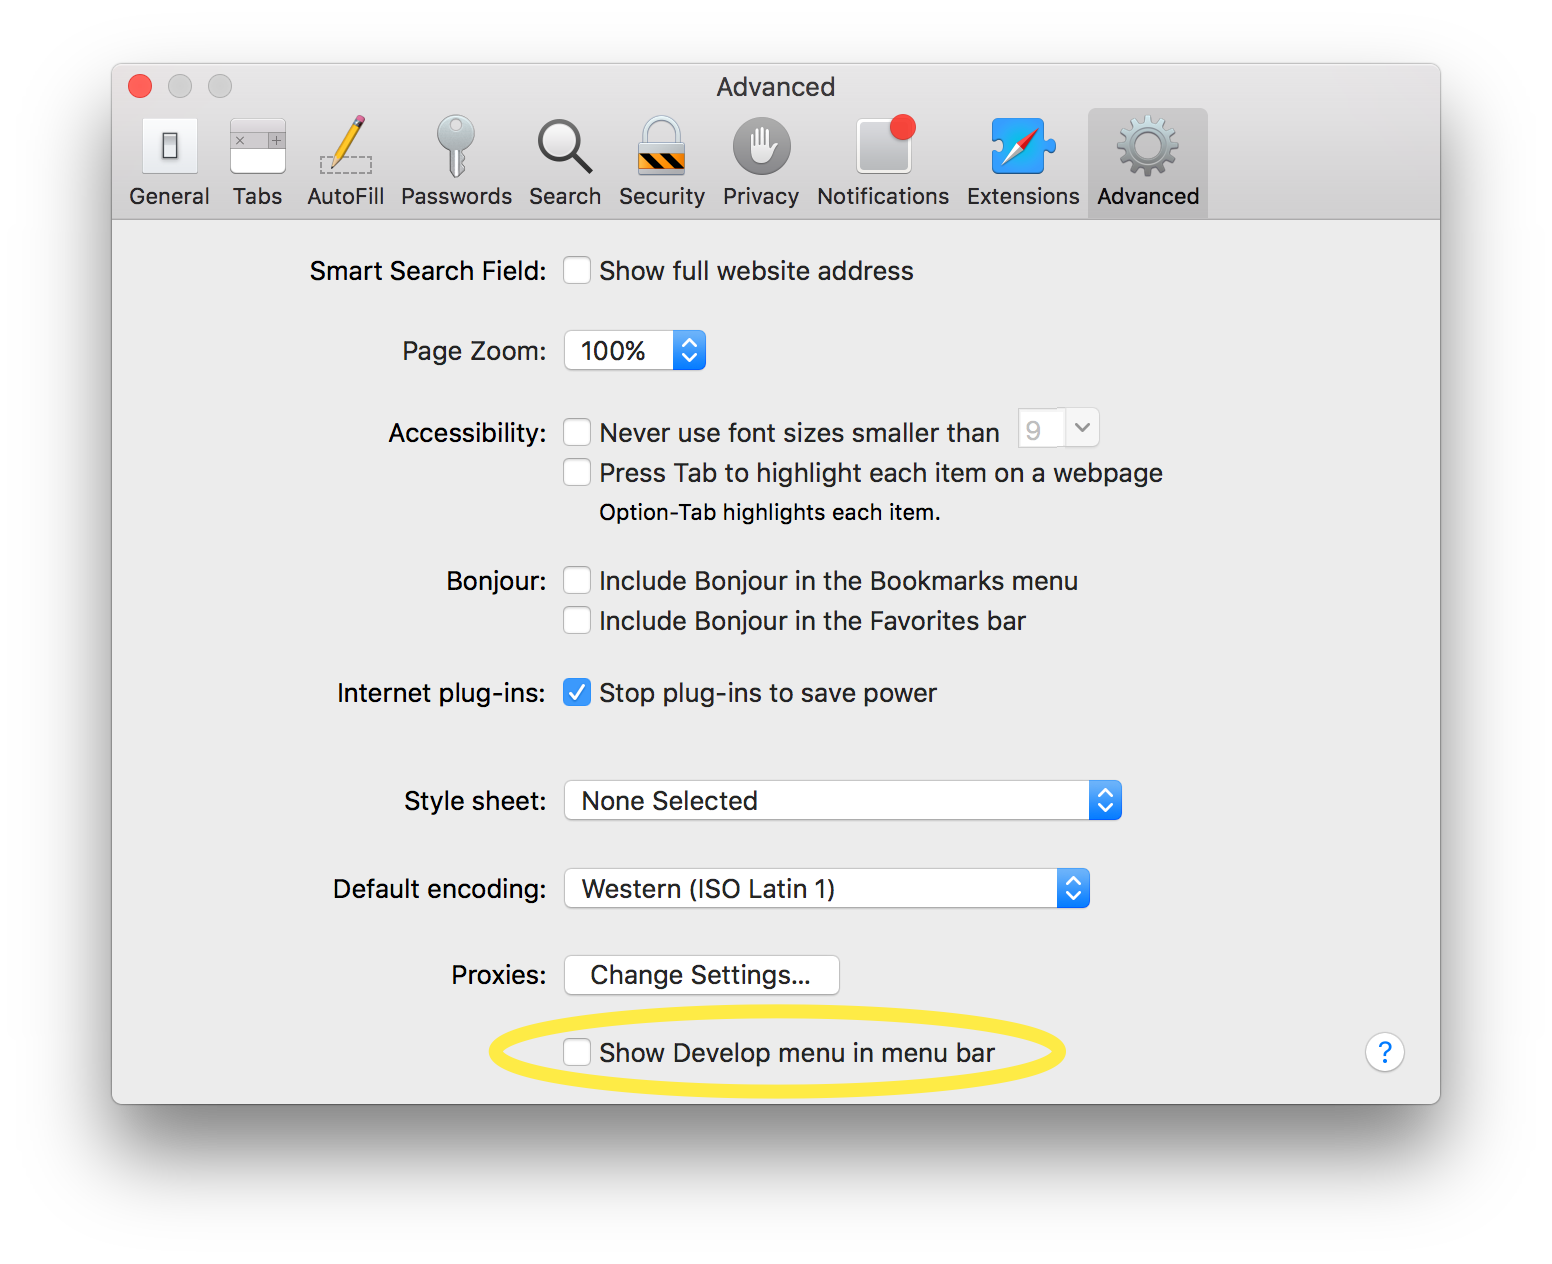
Once in the Preferences dialog, navigate to the Advanced tab, then check the "Show Develop menu in the menu bar" box.
Once the Develop menu has been enabled, you can go to the Develop menu in the menu bar and then select the "Show JavaScript Console" option.